Overview
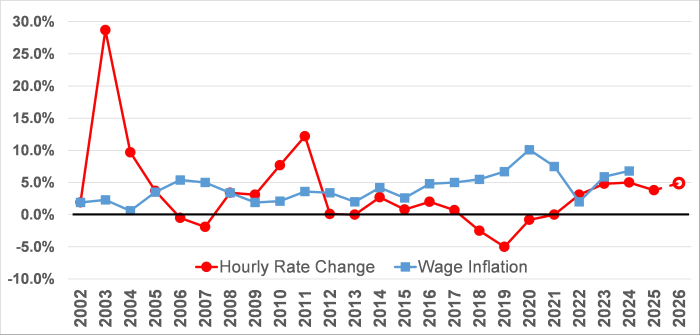
This chart shows the annual percent change in the statewide average wage and the annual percent change in the average workers compensation premium rate per hour going back to 2002.
From 2012 to 2024 the annual percent change in the statewide average wage was higher than the change in the average workers compensation premium rate per hour, except in 2022 where the change in the average workers’ compensation rate per hour was higher.
Values
Numerical values presented in the image:
| Year | Wage Inflation | Hourly Rate Change |
| 2026 | 4.9% | |
| 2025 | 3.8% | |
| 2024 | 4.9% | |
| 2023 | 4.8% | |
| 2022 | 2.0% | 3.1% |
| 2021 | 7.5% | 0.0% |
| 2020 | 10.1% | -0.8% |
| 2019 | 6.7% | -4.9% |
| 2018 | 5.5% | -2.6% |
| 2017 | 5.0% | 0.7% |
| 2016 | 4.8% | 2.0% |
| 2015 | 2.6% | 0.8% |
| 2014 | 4.2% | 2.7% |
| 2013 | 2.0% | 0.0% |
| 2012 | 3.4% | 0.1% |
| 2011 | 3.6% | 12.2% |
| 2010 | 2.1% | 7.7% |
| 2009 | 1.9% | 3.1% |
| 2008 | 3.4% | 3.4% |
| 2007 | 5.0% | -1.9% |
| 2006 | 5.4% | -0.5% |
| 2005 | 3.5% | 3.7% |
| 2004 | 0.6% | 9.8% |
| 2003 | 2.3% | 28.7% |
| 2002 | 1.9% | 1.9% |
- The proposed hourly rate change is shown for 2026.
- Wage inflation percentages are the annual changes in the Statewide Average Annual Wage calculated by the Washington Employment Security Department.
- Hourly rate changes are based on a 3/31/25 distribution of hours by risk classification, assume an average experience modification factor of 0.91, and exclude the impact of the 2007 rate holiday.
Presentation
The annual percent changes in the statewide average annual wage and the average hourly workers’ compensation premium rates are shown as two lines, to compare them over the years 2002-2026.